
DNA Results
Dave Simpson
This is based on an Ancestry DNA test done in December 2018
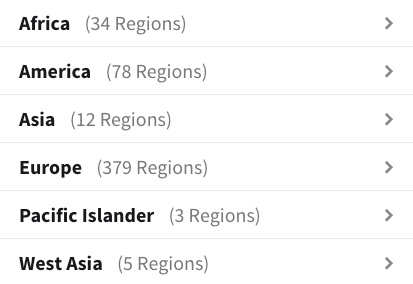
More than 500 regions were tested for DNA matches
The basis result is as shown in the pie chart below:
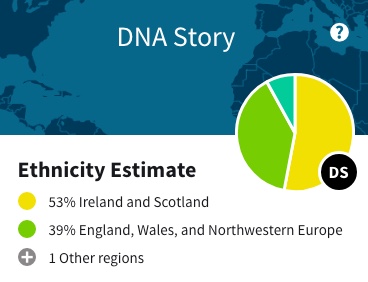
Looking at the chart above we see that 53% + 39% = 92%
So the ‘1 Other regions’ must cover the remaining 8%
The 8% is ‘European Jewish’ which is not broken down into countries.
Ireland and Scotland – This accounts for 53% of my ethnicity.
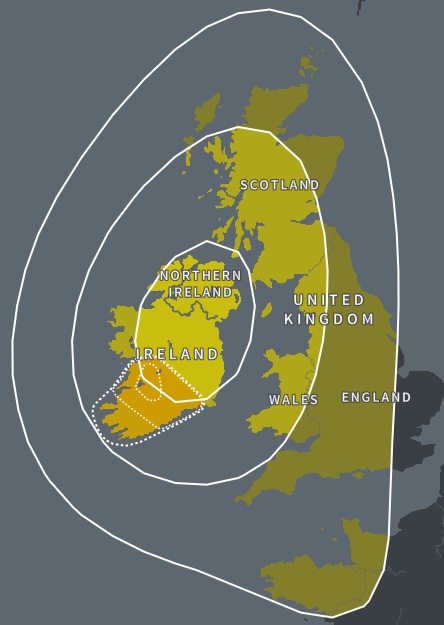
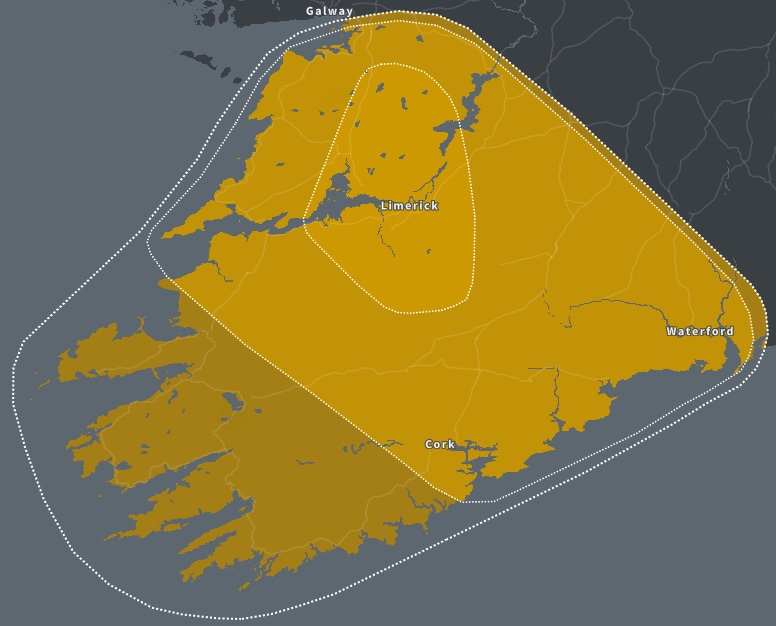
The biggest density is in Ireland, especially around Munster
This is further split in to North Munster and East Limerick & County Clare
Probably through the Carney / Guinnane families
England, Wales & Northwestern Europe – This accounts for 39% of my ethnicity.
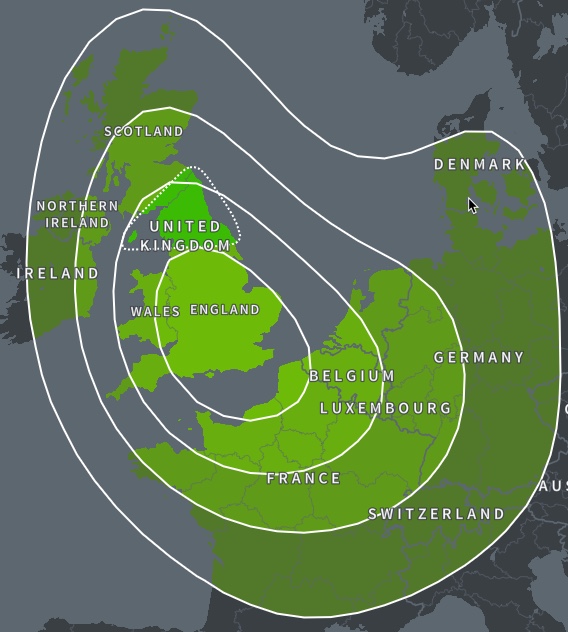
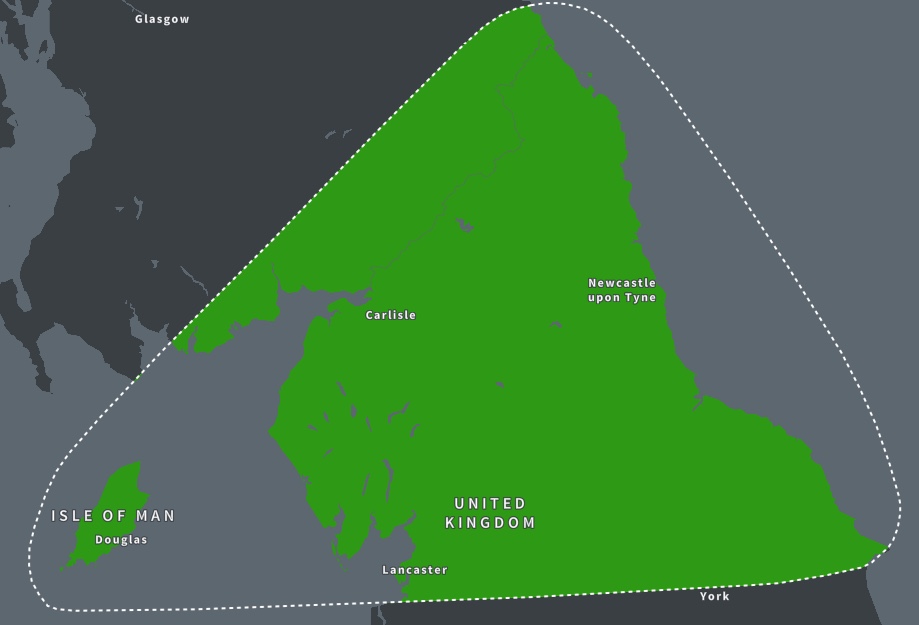
The biggest density is in Northern England
This is mainly through the Simpson / Boulton families.
European Jewish – This accounts for 8% of my ethnicity.
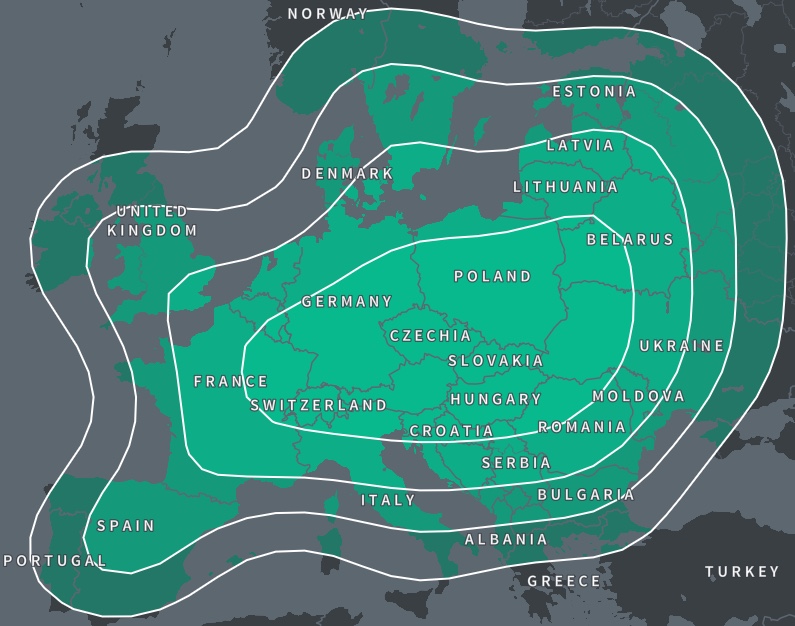
European Jewish cannot be split down into smaller regions but the chart implies that greatest likelihood is the central region.
This will be through the (A)Braham family.